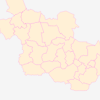
 Standard D3 Maps (using lon-lat geographic coordinates):
The standard way the D3 geo methods work is with data in lon-lat geographic coordinates, being
projected by
d3.geo
functions. Versatile and powerful, especially if using topojson data.
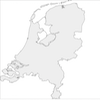 Maps using projected meter coordinates:
Map a geojson with cartesian coordinates, instead of lat-lon's (in this case the Dutch RD) --
Uses an override of standard D3 geo projection behaviour:
don't perform a full projection and resampling, but only a 1st order (affine) translation and
scaling to transform real-world XY-coordinates into SVG screen coordinates...
Maps using projected meter coordinates:
Map a geojson with cartesian coordinates, instead of lat-lon's (in this case the Dutch RD) --
Uses an override of standard D3 geo projection behaviour:
don't perform a full projection and resampling, but only a 1st order (affine) translation and
scaling to transform real-world XY-coordinates into SVG screen coordinates...Includes auto-scaling (responsive) example.
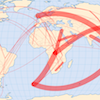 Land Grabbing [Dutch]:
Experimenting with different ways to visualise trans-national land-grabbing (for the Dutch magazine
Geografie):
as a map, as a flow diagram, a force-directed graph and as an OD-matrix...
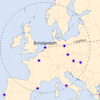 Distance Perception:
Distances in Europe, as perceived by 1st year Geography students --
Students overestimate distances to eastern-European cities compared to Southern-European ones...
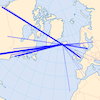 Connectivity of Kevlavik airport:
Interactive visualisation of the flights out of Kevlavik airport (in Iceland).
Filter by brushing of the years and departure times...
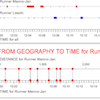 Tool to explore tracks withs stops:
Shows stops and distance travelled in different ways -- as map, as time and
distance equally scaled, as time scaled dependent of distance and as distance scaled dependent of
time.
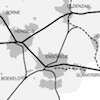 History of railroads in Twente:
This web-map shows the history of the railroads in Twente (a region in of Overijssel province, in
the Netherlands).
Moving the time-slider will show the changes through the years.
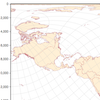 Measuring Distance & Azimuth:
Explains how a Plate-Carré projection can serve as a nifty tool
to show bearing and distance from a location on Earth., where you would normally use a equidistant
projection....
 Watergebruik in Nederland [Dutch] - Sankey flow diagram:
An example of using a non-geographic flow chart (Sankey Diagram) of the use of water in the Netherlands (2016)...
 D3 and Javascript data filter test:
Explains difference between JavaScript standard Array.filter() and d3.filter() function...
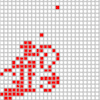 Langton's Ant:
This is an implementation of Langton's Ant using HTML5 Canvas --
Langton's ant is a two-dimensional
Turing machine with a very simple set of rules but complicated emergent behaviour...