This valley has for many years now been the destination for a group of students majoring in Cartography of both Utrecht University and ITC. Two weeks of fieldwork offer them the opportunity to offer various cartographic skills. From 1989 on, remote sensing has been one of them and in recent years an exercise has been developed which lets the students complete a land cover classification of the valley, using SPOT-XS imagery.
The next paragraphs describe and evaluate the results of this exercise. Some
attention will be given to the pre-processing of the imagery and the methods
the students use to collect ground-truth. Comparisons will be made between the
classification schemes used and the accuracy of the resulting landcover maps.
![]() Back
to top
Back
to top ![]()
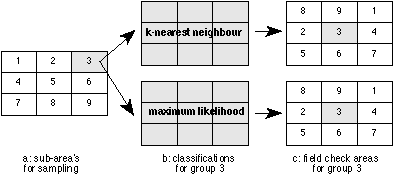
The first day in the field nine teams of two or three students have to locate training areas (class samples) in their sub-area (see figure 1; each area is approx. 3 km2).

Figure 1: Subarea's of the fieldwork area for 9 groups.
Each team has the opportunity to use an ILWIS[1] system for one evening to enter their class samples and classify the satellite imagery. Hard copies at scale 1:15,000 of the classification are produced to be able to check the result of the classification.
The second day in the field each team checks the result of the classification. Based on this field check, an error or reliability matrix is produced. From this matrix the Percentage Correctly Classified has to be calculated.
The required result of this two and a half day's exercise are training data
for a supervised classification, a classified satellite image and an error matrix
as a result of the field check.
![]() Back
to top
Back
to top ![]()
Relief-displacement in the satellite imagery was corrected by means of a Digital
Elevation Model [1]. The DEM was obtained through a linear interpolation of
the 50m contours. These contours were densified where necessary and spot heights
were included. Comparing the image and map co-ordinates of 20 check points distributed
over the area showed an overall planimetric image accuracy of 23.18 m, which
is very good considering the spatial resolution of the imagery of 20 m. The
spectral information within the imagery is ordered according to a vegetation
reflection model. Such a model is particularly suitable for a land cover classification.
The result of applying this model is a Leaf Area Index (LAI) image with information
about the green leaf area, and an intensity image with information about the
terrain slopes and the surface roughness of the land cover classes. The DEM
was again used, now to separate the terrain slope information from the information
on the surface roughness [2]. This corrected intensity image (IntCor) and the
leaf area index image (LAI) were used for the classifications described in paragraph
5.
![]() Back
to top
Back
to top ![]()
Students are advised to first devise a route through there sub-area, in which they have to try to cover as big an area as possible and also as many different forms of landcover as possible. The experience with the surroundings they got in earlier exercises during this fieldwork, helps them with this. The training areas should be groups of pixels with similar spectral characteristics of which you can determine the landcover and which you can locate on the SPOT-image. Each team tries to find several samples of every landcover class.
After returning from the field each team had to enter the samples in the ILWIS
system. This appeared to be time consuming and error prone. Each team took about
3 hours to enter the samples in the ILWIS system. This appeared to be mainly
because of difficulties in finding back on the screen image, the locations of
the samples they noted down on the hard copy image. This is due to considerable
colour differences between the hard copy and the screen. Using Global Positioning
Systems (GPS) to assist ground-truth location could overcome these problems.
Differential GPS with simple code receivers form an excellent data collection
tool for locating ground-truth in this small scale area. Besides capturing the
location of the samples, it is possible to add attribute data for each sample,
like land cover class, parcel size, quality parameters, etc. During the 1995
fieldwork, tests will be made on a procedure to import the GPS-data into the
ILWIS system and perform the classification. The findings hereof will be presented
at the plenary session.
![]() Back
to top
Back
to top ![]()
Using two different classification methods lets the students discover the considerable differences between the two resulting land-cover classifications (discussed in detail in the next paragraph) and thereby letting them appreciate the importance of choosing a classification method and its parameters.
The two methods chosen are among the most used in image processing practice:
k-Nearest Neighbour and Maximum Likelihood.
![]() Back
to top
Back
to top ![]()
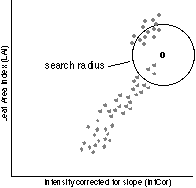
 Figure 2a: k-Nearest Neighbour classification
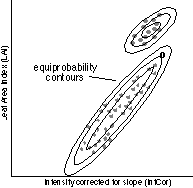
 Figure 2b: Maximum Likelihood classification
In the k-Nearest neighbour classification for every pixel to be classified (O in figure 2a) the nearest neighbours in the feature space are determined. Only neighbours within a certain search radius, as chosen by the user, are considered. If there is more than one neighbour, the class with the most neighbours (predominant class) will be selected. This would be class A in figure 2a. If no neighbours are found within the search radius the pixel is labelled `not classified' [3,4]. Ideally the students would be allowed to experiment with the parameters to the classification, thus being able to compare the results and finally use the one that appears to give the best results. But this would make it impossible to compare the results of the various groups. Furthermore, the tight schedule does not permit much experimenting. Therefore a fixed set of parameters is determined by the staff and used by all the groups. The Maximum Likelihood classification works with likelihood (or equi-probability) contours which are constructed for all the classes in the sample sets. This results in areas of diminishing probability around the mean of every class sample, whose shape and size is determined by the statistical description of the sample classes. The pixel to be classified (o in figure 2b) is attributed to the class with the highest likelihood (probability) for that pixel. In figure 2b, this would be class B. If the likelihood of the pixel belonging to any class is less than a user-defined threshold value, the pixel is labelled 'not classified' [3,4]. All groups will perform these two classification methods using the same parameters, but because every group uses its own sample sets, the results will differ considerably. At this stage the students will notice that:
When looking at these results, students should make several observations:
l] Bargagli, A., Geometric aspects and DTM requirements related
to feature extraction from SPOT images. ITC MSc-thesis, Enschede (1990).
[2] Pickering, R.P., Digital image analysis of SPOT multi-spectral
data for topographic mapping. ITC MSc-thesis, Enschede (1990).
[3] ITC, ILWIS 1.41 User's Manual. ITC (1993).
[4] Lillesand, T.M. & R.W. Kiefer, Remote sensing
and image interpretation. Wiley & Sons (1994).
[1] Integrated Land and Water Information System. A low-cost PC-based GIS system with good image-processing capabilities. ILWIS is programmed and marketed by the ITC.
Published: November 26,
1995
Comments & questions: Barend Köbben (kobben@itc.nl)