Visual Analytics for U.S. Election Data Empowered by Explainable Artificial Intelligence
Short description: This research aims to apply a visual analytics framework, supported by explainable artificial intel-ligence (XAI), to explore U.S. election data from a geographic and visual analytics perspective. Focusing on identifying meaningful patterns in voting behavior and demographic influences, this study leverages the strengths of visual analytics and interpretable machine learning to investigate and analyze key questions in election data. Through this approach, we aim to gain insights that contribute to a nuanced understanding of electoral dynamics and patterns, offering valuable per-spectives.
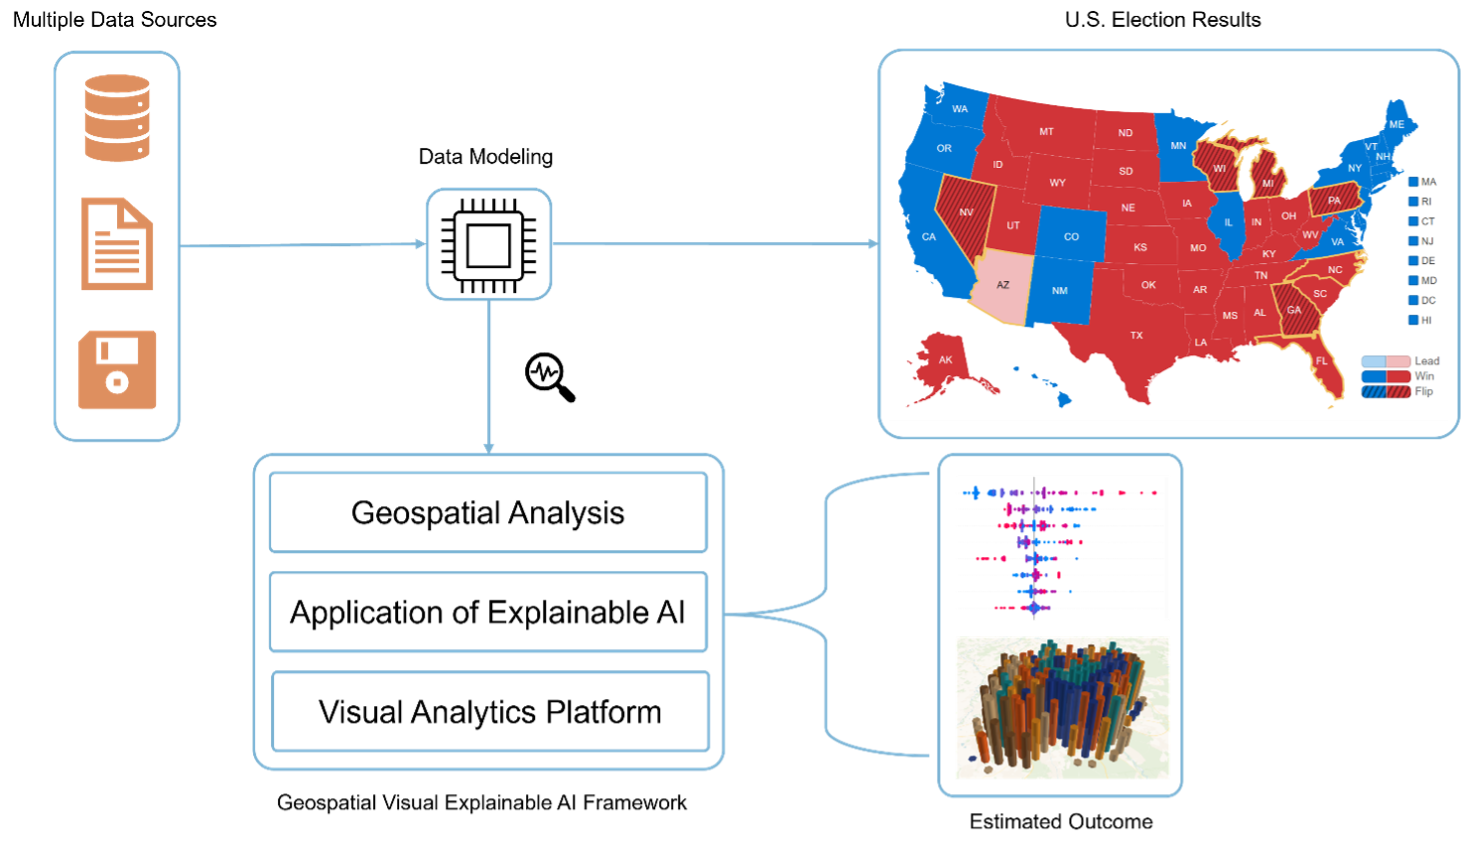
This research seeks to apply a visual analytics framework, enhanced by explainable artificial intel-ligence (XAI), to examine U.S. election data from both geographic and visual analytics perspec-tives. The study is structured into four main steps to ensure a thorough and insightful analysis process:
Data Collection and Integration: The initial step involves gathering data from multiple sources, such as demographic, socioeconomic, and voting records, to build a comprehensive dataset. This dataset will be integrated and standardized to allow for a cohesive analysis of variables influencing voting behavior.
Data Modeling and Geospatial Analysis: The second step uses machine learning models for geospatial analysis, allowing us to model relationships between demographic factors and vot-ing outcomes. By applying geographic data modeling, we aim to capture spatial dependencies and trends in voting patterns across different regions.
Model Interpretation with Explainable Machine Learning: In the third step, we apply interpret-able machine learning models, particularly SHAP (SHapley Additive exPlanations), to provide insights into the model’s predictions. This step includes preliminary visualizations that high-light key predictors in voting patterns, offering transparency into model behavior and allowing stakeholders to understand contributing factors in election data [1].
Spatial Mapping of Voting Patterns: Finally, we employ spatial mapping techniques to inte-grate geographic coordinates and visualize voting patterns across the U.S. By utilizing GeoSH-AP (a geographic extension of SHAP values) [1][2], we conduct an in-depth spatial analysis that further examines regional trends in voting behavior. This approach leverages geographic mapping to reveal nuanced electoral dynamics that might otherwise remain hidden in aggre-gate data.
Through these steps, this study leverages the strengths of visual analytics and explainable ma-chine learning, aiming to uncover valuable insights into electoral dynamics while offering a grounded, exploratory approach rather than conclusive findings. This research seeks to provide a meaningful contribution to the field of electoral analysis by identifying patterns and relationships that inform our understanding of voting behaviors from a geographic perspective.
[Figure below: The conceptual diagram of the research workflow]
Literature/references:
Luo, P. , Chen, C, et al. (2024). Understanding of the predictability and uncertainty in
population distributions empowered by visual analytics. International Journal of Geographical In-formation Science. (Accepted)
Li, Z. (2024). GeoShapley: A Game Theory Approach to Measuring Spatial Effects in Machine Learning Models. Annals of the American Association of Geographers, 1-21.