[id: 106]
Short description: This research aims to apply a visual analytics framework, supported by mathematical formula ex-ploration, to explore subway flow data from a geographic and visual analytics perspective. Focus-ing on characterizing the non-linear response between subway flow and its potential driving fac-tors, this study leverages the strengths of visual analytics and mathematical modeling to investi-gate and analyze key questions in urban transportation. Through this approach, we aim to gain insights that contribute to a nuanced understanding of traffic dynamics and patterns, offering val-uable perspectives for urban planning.
Keywords: Visual analytics, Subway Flow, Mathematical Formula Exploration, Non-linear Response, Geo-graphic Perspective
Topic at: TU Munich
Staff involved: Chuan Chen (chuan.chen@tum.de)
Description:
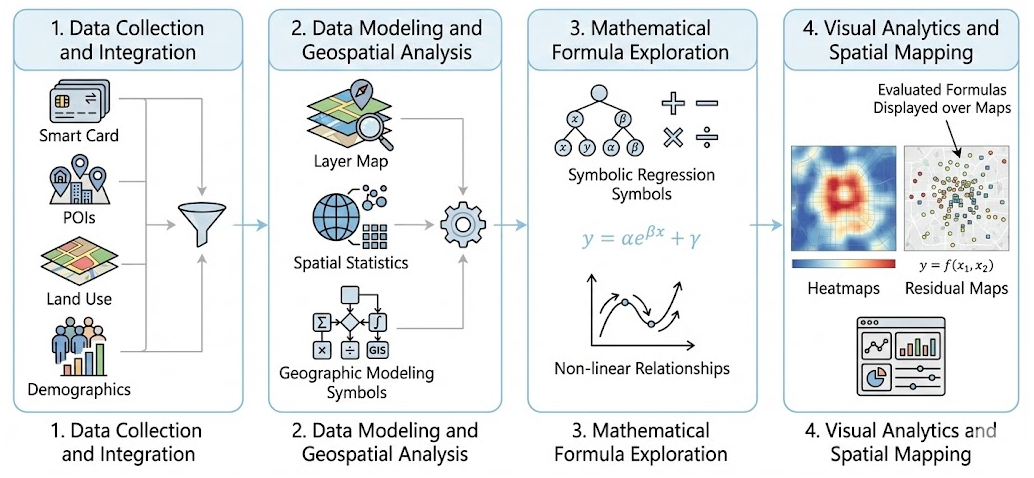
1. Data Collection and Integration: The initial step involves gathering data from multiple sources, such as subway smart card data, points of interest (POIs), land use data, and demographic in-formation, to build a comprehensive dataset. This dataset will be integrated and standardized to allow for a cohesive analysis of driving factors influencing subway flow.
2. Data Modeling and Geospatial Analysis: The second step uses statistical methods for geospatial analysis, allowing us to model relationships between urban features and subway ridership. By applying geographic data modeling, we aim to capture spatial dependencies and trends in traf-fic patterns across different stations and regions.
3. Relationship Exploration with Mathematical Formulas: In the third step, we apply mathemati-cal formula exploration methods (such as symbolic regression) to explicitly formulate the rela-tionship between subway flow and its driving factors. Unlike black-box models, this step aims to discover interpretable mathematical expressions that characterize the non-linear response of ridership to changes in variables like commercial density or residential population. This pro-vides transparency and allows stakeholders to understand the precise mathematical nature of contributing factors.
4. Visual Analytics of Formula Performance and Patterns: Finally, we employ spatial mapping techniques to visualize the performance of the derived formulas and the spatial distribution of residuals. By utilizing a visual analytics platform, we conduct an in-depth spatial analysis that examines how well the mathematical formulas explain subway flow in different geographic contexts. This approach leverages geographic mapping to reveal nuanced dynamics, such as where the formula fits well and where local anomalies exist.
Through these steps, this study leverages the strengths of visual analytics and mathematical explo-ration, aiming to uncover valuable insights into urban mobility dynamics while offering a grounded, exploratory approach rather than conclusive findings. This research seeks to provide a meaningful contribution to the field of transportation analysis by identifying non-linear patterns and relation-ships that inform our understanding of subway flow from a geographic perspective.
Literature/references: