|
In 1812 Napoleon invaded Russia.
This Campaign has become one of the most widely studied military
adventures. Napoleon started this campaign in the Summer of 1812
with an impressive army of approx. 600,000 men. 550,000 of them
did not survive this Campaign. Most of them did not suffer from
battles but lost their lives due to lack of food, illness and
extreme low temperatures during the retreat of the French Army
in November 1812.
The Campaign lasted from June 1812 - Jan. 1813 and can be divided
into 2 major Campaign periods. There is a overwhelming amount
of documentation and statistical data available.
Maps and the 1812 Campaign
Next to the written documentation and statistical
information also many maps are available. Using these data as
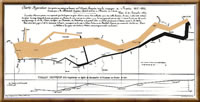
a starting point, the French cartographer Charles Joseph Minard
designed in 1844 "La
Carte figurative des pertes successives en homme de
l'Armee Français dans la campagne de Russe 1812-1813".
This map is described by some as the "best graphics ever
produced" (Tufte, 1983) and is also considered as one of
the first statistical maps.
Minard, French cartographer
Friendly (1999) considers Minard as a "pioneer
in what geographers call thematic cartography". Before becoming
a cartographer, Minard was an instructor at the École Nationale
de Ponts et Chaussées (ENPC). This was a training school
for engineers responsible for building roads, canals etc. and
therefore many of Minard's maps are often concerned with the visualization
of transport streams by means of flow maps.
Also the "Carte figurative etc" is such a map. Minard
is also considered as the first cartographer applying divided
proportional circles (pie graphs) in his maps ( Wallis and Robinson,
1987).
Many other cartographers have seen then tried to design maps reflecting
every aspect of this impressive Campaign. Most of these maps are
printed. And, just like in any other paper map, they may contain
detailed information on specific aspects of the campaign.
GIS based maps
Nowadays, GIS offers the option to create maps entirely based
upon statistical data, as long as they are geographically referenced.
The map as shown here
(designed by the Sage Visualization Group) is a good sample.
Cartographic, multi-media and web design soft wares offer cartographers
the possibility to design map products that may differ in a number
of aspects from paper maps. Most printed maps are still presenting
spatial information by a number of rather conventional, cartographic
visualization methods, based upon the application of Bertin's
Semiology Graphique (1962). Graphic and web design software nowadays
offer a number of options to apply some 'derived" graphic
variations such as transparency, shadow and shading. The same
software offers cartographer a box of Pandora loaded with graphic
"tricks" to enhance maps with illustrations, background
structures, graded tints. Hyperlinked map objects open the way
to underlying levels of related and/or more detailed information
in the form of other maps, statistical data, text, graphs, animations
and/or movies. The Web offers also the possibility to disseminate
such products to a wide, interested public without the normal,
additional costs of (for instance) printing or the production
of CD-ROMs.
This project aims at the design and production
of an inter-active , on-orthodox cartographic presentation on
specific aspects of the 1812 Campaign. Simultaneously, such a
presentation should not lead to loss of reliability and legibility
of the presented data.
Back to introduction
|
|
|
|
1.2 Project aims and objectives
Project aims:
The aim of this project was to design and
produce a cartographic Web based presentation of the 1812 Campaign
of Napoleon to Russia, using commercially available (carto) graphic
and web design software.
By means of interactive maps, the Web user gets a overview of
the most important Campaign events.
Multi-medial elements such as animations and sound play a essential
role in the project as another mean to confront the user (lively)
with factors that played a role in the defeat of Napoleon's troops.
Factors such as: the un-predicted resistance of the Russian troops,
supply shortages, illnesses among the French troops and season
related temperature conditions.
The site will also enable web users to get a insight into the
general statistics of the 1812 Campaign, such as number of troops,
causalities, battle losses etc, whether temperature etc.
The project is also a study to gain staff experience in the design
of multi-medial, inter-active maps and the practical application
of Web design software to produce such maps.
Project objectives:
Offer visitors a multi-media supported website,
dedicated to the Napoleon's 1812 Campaign to Russia and give a
presentation of the major military events during this campaign,
by means of static and dynamic (view only) and/or inter-active
web maps.
Confront web site visitors with a non-conventional web map design
approach.
Offer web site visitors tools to explore available statistic data
as well as less tangible information such as seasonal conditions
met by Napoleon's forces by means of inter-active web maps.
1.3 Applied software:
To establish the site the following software
has been applied:
| ESRI |
 |
ArcView 3.2 |
| Adobe |
 |
Photoshop 5.1 |
| Macromedia |
 |
DreamweaverUltraDev 4.0
FreeHand 10
FireWorks 4.0 |
| Avenza |
 |
MaPublisher
4.0 for Freehand 9/10 |
Back to introduction
|
|
|