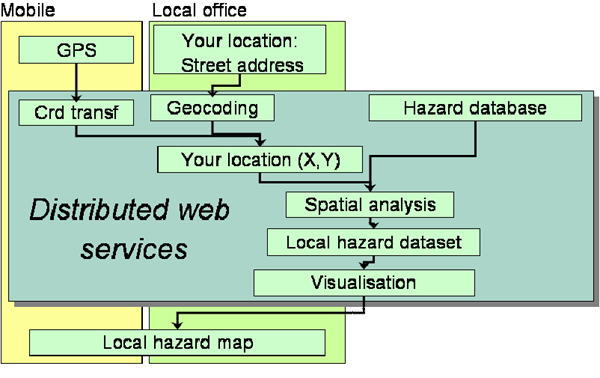
Figure 1: Screendump of a fragment of a test sheet for the “Model-risicokaart” of the Dutch Ministry of Interior.
Keywords: Web Mapping, Presenting GML with SVG, Data-driven graphics, Case studies
Biography
Barend Köbben holds an MSc in Geography, specialising in Cartography, from Utrecht University in The Netherlands. He worked for 9 years as a Lecturer in cartography at that University and then moved to become a Lecturer in GIS and cartographic visualisation at the International Institute for Geo-information Sciences and Earth Observation (ITC). The ITC is an international school providing courses on GIS and Remote Sensing to students from all around the world, ranging from commercial short courses, through 12 month Professional Master and 18 month MSc degree courses to PhD programmes.
His teaching subjects include WebGIS and WebCartography, 3D visualisation, multimedia and image mapping. He has been involved in various consultancy projects in The Netherlands, Malaysia, Iran, Zambia and India and he participates in the internal ITC research programme SLARIM (Strengthening Local Authorities in Risk Managment).
He is the Webmaster of the Dutch website for Cartography (http://www.kartografie.nl) and is a member of the editorial board of Geografie, the journal of the Royal Dutch Society for Geography.
This paper presents results of a proof-of-concept implementation, using SVG for Risk Indicator Maps (RIMs). These maps are to be be part of an urban risk management system, and therefore need to be fit for a multitude of tasks, ranging from providing the general public with information about risks to providing local authorities an interface to the underlying risk assessment databases and models. Furthermore, the maps need to be usable on a wide range of platforms, from the office systems of the local authorities, through public access via the WWW, to handheld devices providing location based services to field personnel. The required versatility, scalability and the need for the mapping solution to fit in a framework of component based interoperable web services led to the decision to use XML-based solutions in this workpackage, and thus GML for spatial data exchange and SVG for visualisation. It was decided to try out the concepts developed in the workpackage in a small proof-of-concept implementation. The application should deliver scalable, on-line RIMs to a number of possible clients, including PDA's. The maps are generated server-side, from online distributed data into SVG-based maps offering visualisations of risks as well as access to underlying data. The implementation of this proof-of-concept application has started is March 2003, this paper will present the results and discuss its conceptual and technical setup.
Introduction
The SLARIM project
Structure of the project
Visualisation and Use of Risk Indicator Maps
Cartographic design of RIMs
Technical concepts of RIM Web services
Preliminary tests on risk visualisation using SVG
Conclusion
Bibliography
This paper presents results of a proof-of-concept implementation, using SVG for Risk Indicator Maps (RIMs). These maps are to be be part of an urban risk management system, and therefore need to be fit for a multitude of tasks, ranging from providing the general public with information about risks to providing local authorities an interface to the underlying risk assessment databases and models. Furthermore, the maps need to be usable on a wide range of platforms, from the office systems of the local authorities, through public access via the WWW, to handheld devices providing location based services to field personnel. The required versatility, scalability and the need for the mapping solution to fit in a framework of component-based interoperable web services led to the choice for SVG.
The research described in this paper is part of the larger framework of the project "Strengthening Local Authorities in Risk Management" (SLARIM). The objective of this ITC internal research project is the development of a methodology for the implementation of risk assessment and spatial decision support systems for risk management by local authorities in flood and earthquake threatened urban areas in developing countries [1] .
We are confronted almost daily in the media by the tragic consequences of the negligence of urban risk management, resulting in disasters that might have been prevented. These examples may be from our own developed countries, or even our own city (the 2000 firework explosion in Enschede), as also in the Netherlands a considerable percentage of municipalities doesn't have an adequate risk assessment and an emergency plan. However, more often such examples come from developing countries, where levels of risk are higher due to higher levels of vulnerability. This larger risk in cities in developing countries is due to a number of factors, such as increased vulnerability of low level neighbourhoods, both in terms of it's buildings and it's inhabitants, lack of resources for proper planning, lack of spatial information in order to make the right decisions. Even if such spatial information is available, it may be dispersed through different local authorities, without a operational procedure for information sharing.
In order to be able to effectively take measures on risk reduction local authorities must be supplied with reliable, up-to-date, and interpreted information on the nature and geographical distribution of hazard and risk, and the possible risk scenario's. Risk assessment is considered as the central and most important aspect within disaster management. Risk is defined as "the expected number of lives lost, people injured, or economic losses due to potentially damaging phenomena within a given period of time". It is based on three components: probability (of the hazardous events and their magnitude), vulnerability of the elements at risk (expected degree of loss) and the replacement value of the elements at risk.
Risk information, presented spatially, is needed by local authorities to take decisions on how to reduce the risk for particular areas, either by reducing the hazard probability (eg. structural measures like dikes) or by reducing the vulnerability (eg. restrictive zoning, building codes). Risk information also forms the basis for a proper emergency response planning.
The project focuses on the two types of natural hazards that cause most damage in urban areas: flooding and earthquakes. The methodology will be developed in a number of case study cities in different countries. Thus far Lalitpur in Nepal (for earthquakes and flooding), Dehradun in India (earthquakes) and Naga in the Phillipines (flooding) have been chosen.
The project will follow a sequence of work packages, dealing with analysis of the institutional setting, user needs assessment, evaluation of the spatial data infrastructure, hazard assessment, generation of databases of elements at risk, vulnerability assessment and risk assessment. The most prominent are:
The main deliverable of this project will be a web-based training manual for the use of geoinformation in urban risk assessment and management. Apart from that the methodology will be developed in a number of case study cities in different countries.
Within the SLARIM project, work package 3000 deals with the spatial data infrastructure and base data aspects of a flood/seismic risk assessment system, directed towards the needs of medium sized local authorities in developing countries. The activities within this work package include the development of a methodology to handle interoperability aspects. Distributed processing, interoperability research and the impact of the OpenGIS specification will play an important part in this activity. The author of this paper is responsible for "recommendations concerning the methods for the online mapping and presentation of risk indicators". The main activities include:
The first activity requires research into the cartographic grammar for visualisation of real and perceived risks. For this, a theoretical review into perception properties for RIMs is needed and the visual variables best matching these should be determined, combined with a best practices review into the real solutions already in use.
In order to design cartographically sound RIMs, one needs a thorough analysis of the geospatial risk data. This includes the geometric aspects as well as the thematic attributes. Are the data modelled as fields or as objects? Are they continuous or discrete? Is the geometry raster, vector or a combination of both? What are the measurement levels of the thematic data values. The answers to most of these questions are to come from other work packages in the project, because that's where the decisions about data modelling and geometry and attribute data acquisition are going to be made.
Once the data has been analysed, the cartographic grammar for visualisation of the risk information has to be developed. Towards that goal, a theoretical review of the perception properties connected with the data properties will be conducted, as well as a 'best practices' review, an inventory of solutions as found in the real world. An important input to that inventory will be the project currently undertaken by ITC staff on visualisation of risks for the “Model-risicokaart” (see Figure 1 ) of the Dutch Ministry of Interior. This “Model-risicokaart” (Model Risk map) is to become a standard for Dutch provincial risk maps [2] .
Figure 1: Screendump of a fragment of a test sheet for the “Model-risicokaart” of the Dutch Ministry of Interior.
There are some specific problems when trying to devise cartographic symbology for RIMs, specifically if the intended output medium is an online vector file such as SVG.
Firstly, risk information is virtually always modelled, not “real” measured or sensed data. Therefore, the original risks, originally fuzzy information with no clear geometric boundaries nor crisp attribute definitions, will mostly be modelled as crisp information, both geometrically and thematically. The challenge is to recreate the fuzziness and uncertainty of the original risks when visualising them. The information available in most cases is about the location of the actual disaster or its source, for example the geological fault that is a potential epicentre for earthquakes, or the watershed where flash floods will originate. Information about the risks to inhabited places that will actually be affected by such a disaster is usually much sparser and less well defined. Furthermore, there is a considerable difference between the real risks attributable to specific locations, and the perception of those risk by the general public. This difference has to made evident.
Secondly, the information coming from the risk models is available in various different and often incompatible spatial domains. The necessary base data (topography, buildings, infrastructure) is usually in the vector domain, while the geometry of model results is often in the form of continuous fields, which are hard to visualise in vector form.
A third challenge is the diversity of the user groups the RIMs are aimed at, which are expected to be very heterogeneous, ranging from government institutions to the general public, with user needs that almost certainly will not match.
For this second activity, visualisation will be considered as part of a system of interoperable (web) services. The reason for this is that such a system could support on-line, distributed data from various local authorities. It would also be scalable, ranging from in-office planning to rapid response in the field, and time-aware, supporting comparisons, real-time views and extrapolation into future scenarios. All these requirements have led to the decision to use XML-based solutions in this work package, and thus to GML for spatial data exchange and SVG for visualisation.
It was decided to try out the concepts developed in the work package in a small proof-of-concept implementation. The application should deliver scalable, on-line RIMs to a number of possible clients, including PDA’s. The maps are generated server-side, from on-line distributed data into SVG-based maps offering visualisations of risks as well as access to underlying data.
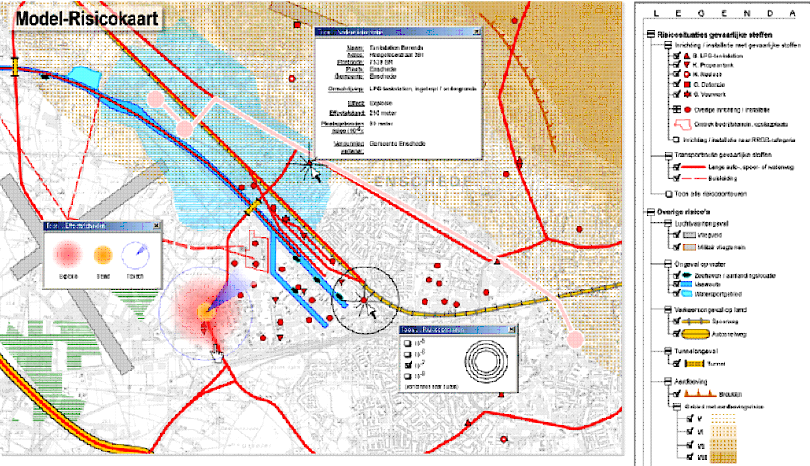
A typical scenario for such a Web services solution (see Figure 2 ) might be the determination if certain locations are in danger in case of a disaster event. Such a user question “is this place in danger?” might be posed by somebody out in the field using a mobile information device (say, a GPS-enabled PDA). The GPS location would be translated to an appropriate user location by using a co-ordinate transformation service. A similar question asked by an office worker with a desktop system might use a postal code as its location input, which would be translated to a geographical location by a geocoding service. Both systems would then access a hazard database with the real or modelled risk zones and use the appropriate spatial analysis to derive ea localised hazard database. This would then be visualised, resulting in a localised hazard or risk map on either the PDA or the PC.
The implementation of the proof-of-concept application has started in March 2003 and will continue until the end of 2004. Figure 3 outlines the conceptual setup. All this is pretty much a “work in progress” and the final implementation is likely to be slightly or considerably different from the ideas presented here. The main building blocks of this system will be a spatial database back end that stores the geometry and the attribute data; For this part both PostGIS (an spatial data extension to PostgreSQL) and MySQL (the latest alpha version supports spatial data) are under consideration; Spatial data storage should be using the OpenGIS simple features specifications. Next there will be a set of web applications that extract data from the database and delivers it in SVG for mapping purpose and other XML formats (such as GML) for data exchange. These will be developed using Apache technology (Tomcat JSP and servlets and possibly the Cocoon application framework).
In the current first phase the emphasis is on developing a web-based user interface enabling access to the maps and data for both desktop browsers as well as mobile platforms. At the time of writing (May 2003), some preliminary tests have been undertaken to realise these in SVG format suited for multiple platforms (see [3] ). For these tests, data from the city of Kathmandu in Nepal was used. These included base data of roads, rivers and building blocks as well as an earthquake vulnerability model for these building blocks, based on various parameters such as the construction materials, height of the buildings, etcetera. Furthermore, some theoretical flood zones were constructed, indicating areas that are expected to be subject to flooding every year, once in three years or once in five years. All this data was edited and stored using ESRI's ArcMap.
For the map shown in Figure 4 , the original data has been exported using the ArcMap extension MapViewSVG [4] . This easy to use, wizard driven exporter is a simple way of constructing client-side, interactive, data-driven maps. The data layers can be turned on and off, the map can be zoomed and panned and the attributes of the data can be accessed, either by selecting map elements or by using query functionality. For the purpose of this project, however, there are some disadvantages: MapViewSVG uses HTML wrapping of several SVGs in browser frames, requiring frame-to-frame communication between the SVG DOMs and therefore only works properly in Microsoft's Internet Explorer in combination with the Adobe SVG viewer. The exporter also uses the SVGfull profile. All this means the system is not platform independent and certainly not suited for mobile application.
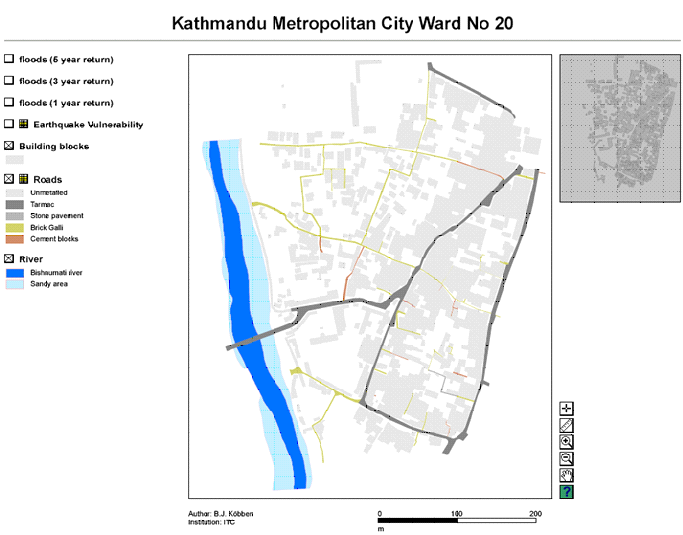
Figure 4: Output of original ArcMap project through MapViewSVG
(screendump, for original go to https://kartoweb.itc.nl/RIMapper/SVGopen2003/mapviewsvg/)
The example in Figure 5 therefore is implemented using the SVGbasic profile, to ensure better usability on PDA's. The BitFlash SVGBasic viewer [5] was used to test compliance and the performance on an IPAQ PDA. The map layout has been simplified for use on smaller screens by removing the overview map and tools and having the interactive legend only pop up when the user clicks the mouse.
Further experiments were undertaken to visualise the risks in a more appropriate way. The map shown in Figure 6 shows a flood risk symbol centered on the position of the mouse. The size of the circle symbol changes with the flood risk at the mouseover location. The circles is drawn with a gradient fill, giving it a 'fuzzy' outline to emphasise the uncertainties of the underlying data. The original flood data on which the symbol size is based is shown while the user holds the mouse button down. A similar map was constructed for the earthquake risk alone (not shown) and for the combination of these two risks ( Figure 7 ).
Although the proof-of-concept application mentioned in the earlier paragraphs is still a long way from being fully functional, the results of these first tests have strengthened us in our believe that SVG combined with a database backend offers the tools to build a system that can deliver powerful and user-friendly Risk Indicator Maps to a broad array of users. The progress of the project will be monitored on the RIMapper project site [3] , which will offer updates and examples of the maps and services as they are developed in the next year or so.
XHTML rendition created by gcapaper Web Publisher v2.0, © 2001-3 Schema Software Inc.